CPI & 10yr.
Occasionally, it’s nice to look back at some older charts or metrics that used to be in greater focus, just to review. One that caught our eye recently is the correlation between US CPI and both the 10yr TSY as well as the 2yr TSY.
The correlation is rather strong:
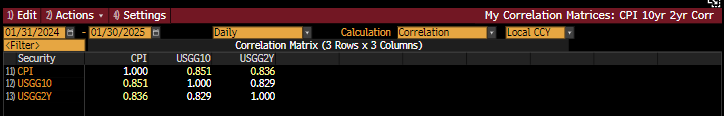
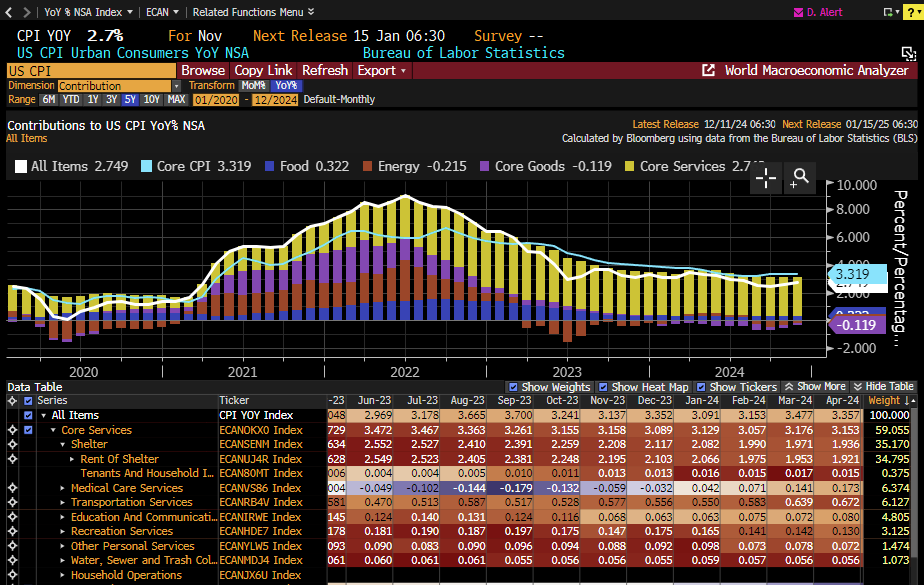
We thought the .851 is notable, so it led us to take a deeper dive into the CPI. We all know Inflation has been top of mind since the Fed began its raising cycle and even more deeply followed once that course was reversed.
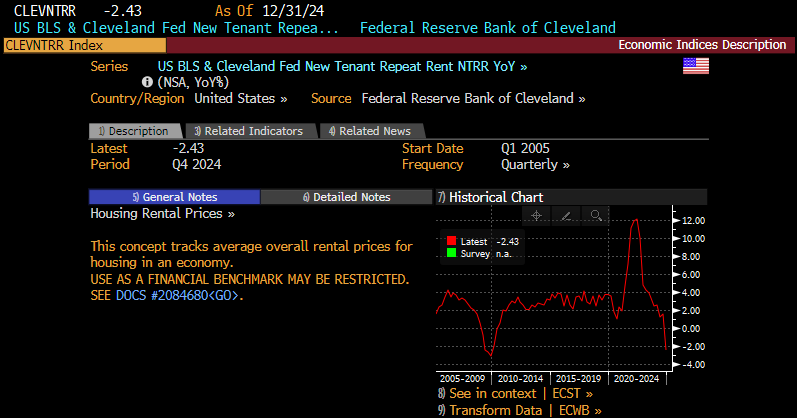
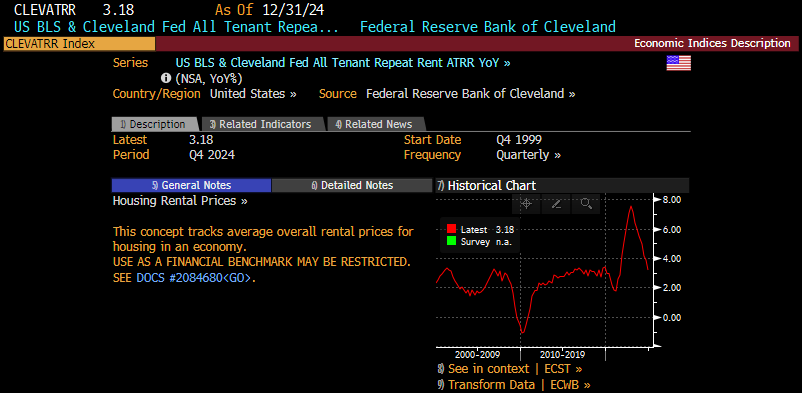
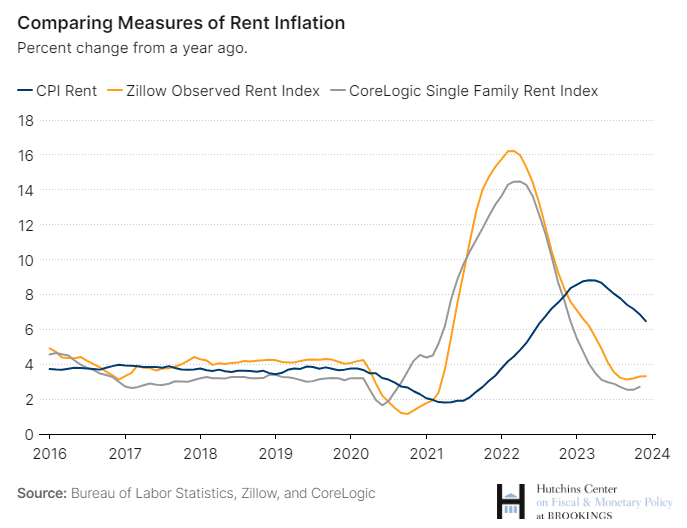
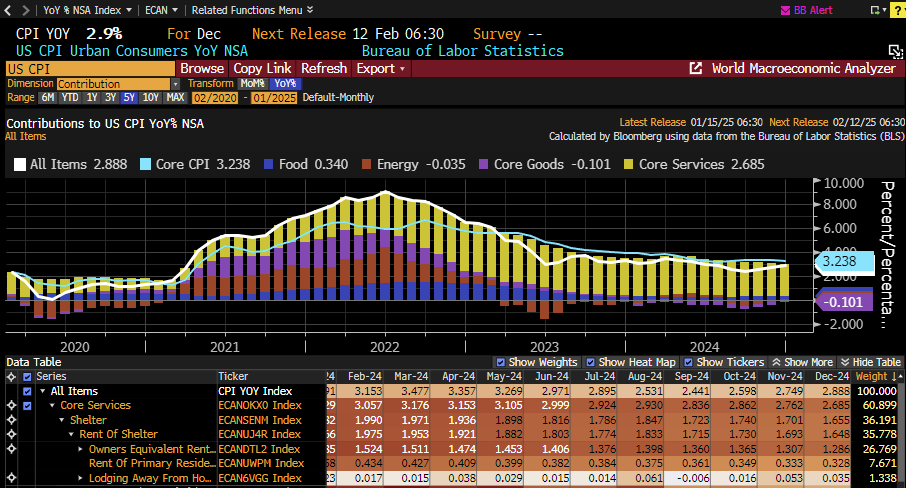
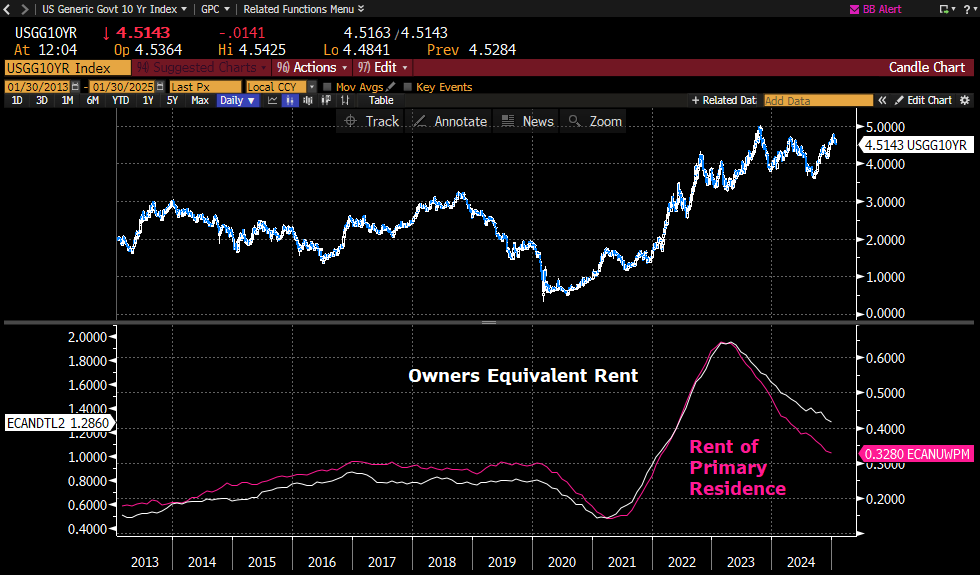
Core Services is the greatest single sector contributor to the CPI, and of that 61%, 34%-more than ½-is directly related to shelter.
Below we have the 2 components that add up to 34% of the CPI. As the chart depicts below, both metrics have yet to return to pre covid levels.
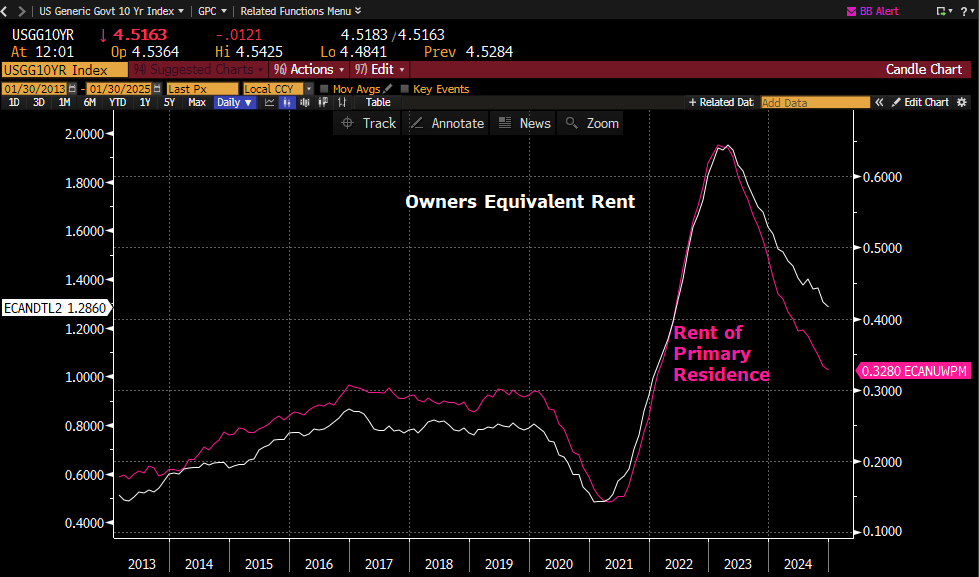
Why focus on these 2 metrics, other than their weightings in the CPI?
Well, Pending Home Sales were reported Thursday, January 30th, and the YoY number came in well below expectations:
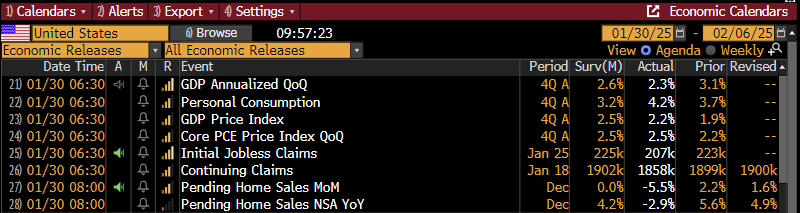
As seen above, a big miss on the Pending Home Sales YoY, 4.2% Est vs -2.9% actual, is what caught our eye.
So, Sales are certainly falling off, but what about supply? Could it be supply is spooking would be buyers?
Does not look like it from the below chart.
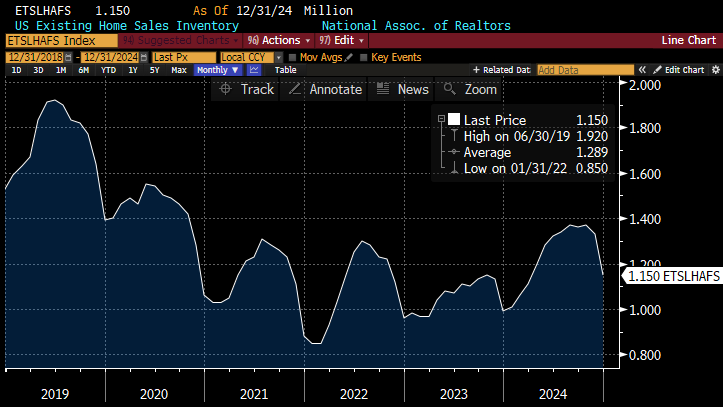
Hard to miss the media not mentioning that Housing supply is lacking. If we look a little deeper though, through a seasonality lens, it appears we are headed into the time of the year where inventory builds.
Below is a Heat Map showing Inventory by month, same metric as the above chart.
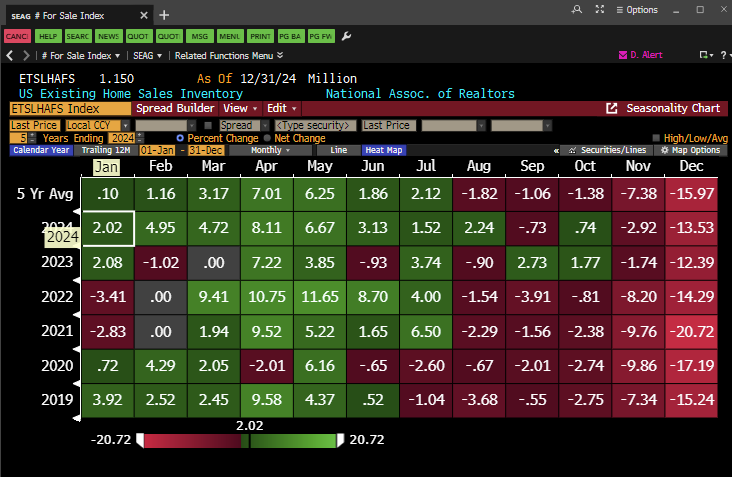
As seen from the 5-year averages above, Inventory seasonally grows January through July.
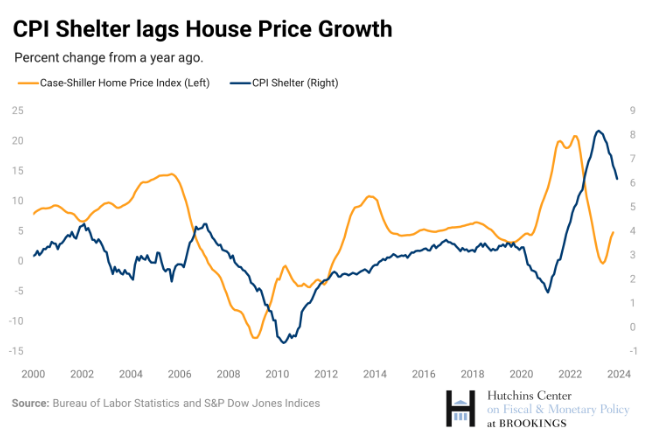
One part of the home sales equation we have yet to mention is the affordability part. Home prices over the last 5 years have doubled wage growth.

Affordability has become a serious headwind, most likely being a large contributor to the Pending home sales miss on Thursday.
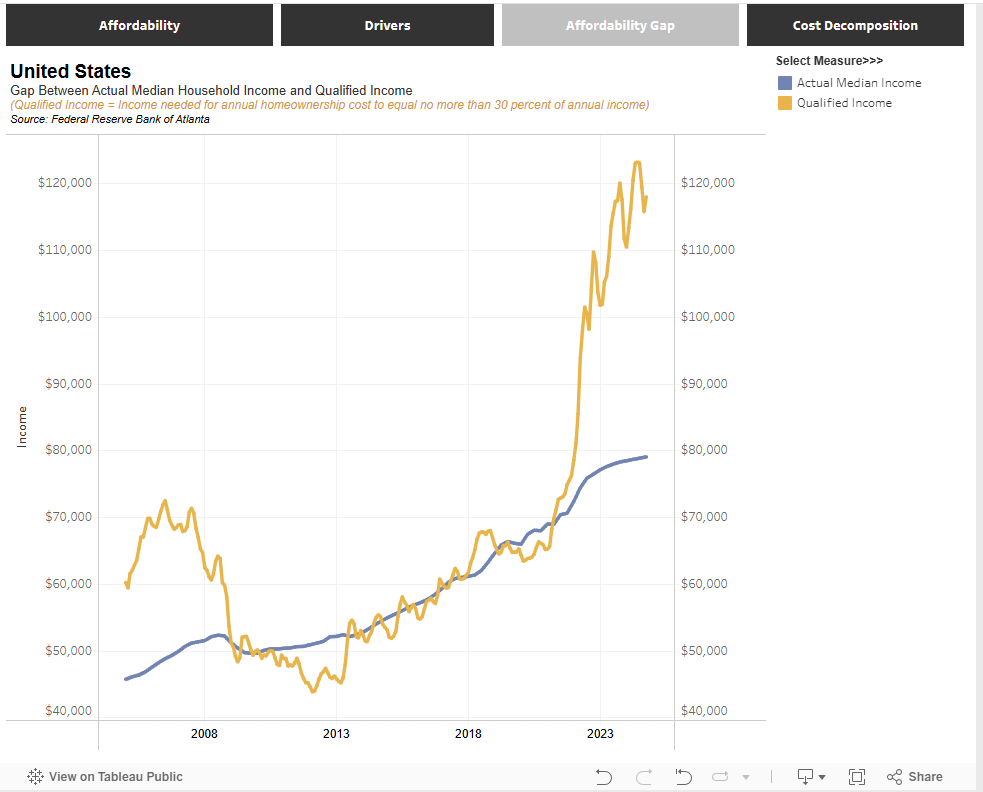
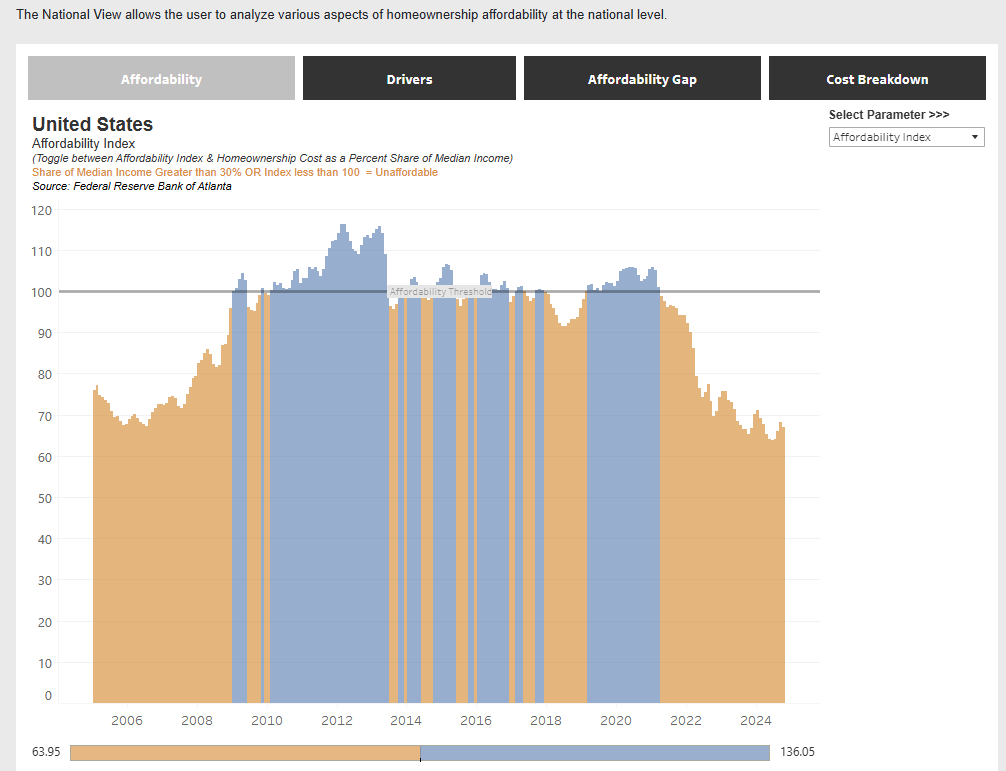
or looked at in a different way:
Both charts are interactive and from the following link in case anyone would like to take a deeper dive:
https://www.atlantafed.org/research/data-and-tools/home-ownership-affordability-monitor
It is hard to believe in a scenario where the 2 constituents of the CPI mentioned above could move higher and continue to help elevate the CPI Index itself. Between the headwinds of affordability and seasonality, pricing could see its momentum change.
The .85 correlation would lead one to believe the 10yr TSY could begin to feel the impact of those headwinds.
Employment
Is the US job market weakening under the surface? The average duration of unemployment in the US jumped to 24 weeks in December, the highest in nearly 3 years. Over the last 2 years, the average duration of unemployment has jumped by 5 weeks. The time it takes Americans to find a new job is now higher than in any other period before the 2008 Financial Crisis. This data coincides with new job postings on Indeed falling over the last 3 years to near their lowest since the 2020 pandemic.
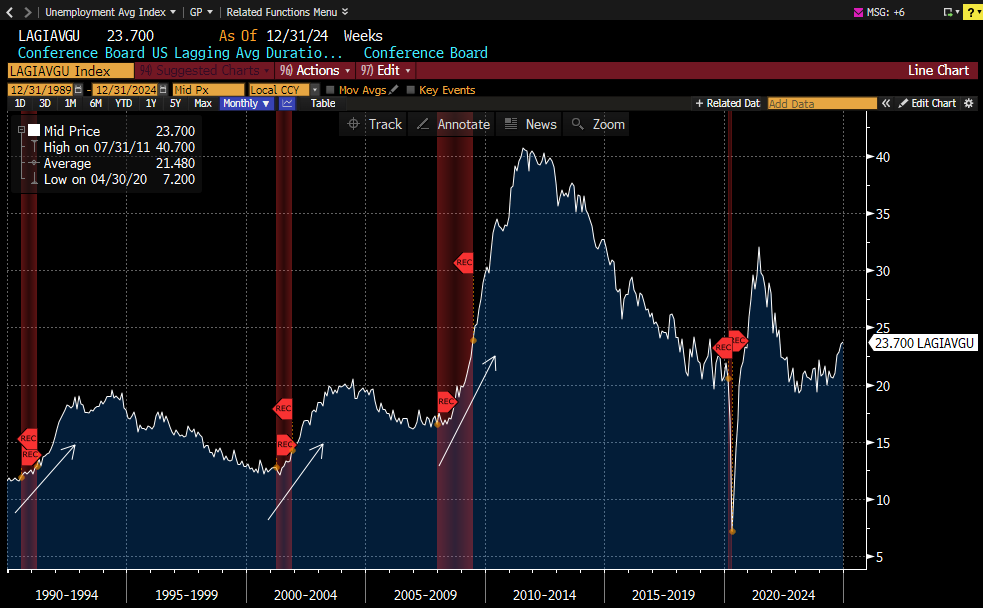
As seen above, other than during Covid, every time this metric begins to move up, a recession seems to appear.
The Indeed job postings below.

Have a great weekend!
Best
Meraki Trading Team
About Meraki Global Advisors
Meraki Global Advisors is a leading outsourced trading firm that eliminates investment managers’ implicit and explicit deadweight loss resulting from inefficient trading desk architectures. With locations in Park City, UT and Hong Kong, Meraki’s best-in-class traders provide conflict-free 24×6 global trading in every asset class, region, and country to hedge funds and asset managers of all sizes. Meraki Global Advisors LLC is a FINRA member and SEC Registered and Meraki Global Advisors (HK) Ltd is licensed and regulated by the Securities & Futures Commission of Hong Kong.
For more information, visit the Meraki Global Advisors website and LinkedIn page
Contact:
Mary McAvey
VP of Business Development